
The reporting dashboard
The reporting dashboard answers how much time went where. It is a Plot View component totalling hours from time objects, grouped by whatever the question is about — customer, project, work type or person.
By the end of this example there is a Time Reporting dashboard with one grouped bar chart on it.
Before you start
Section titled “Before you start”- CtrlTime set up, with time entries already booked. A chart over an empty vault is hard to check.
- The hours property on time objects populated. The chart sums it; entries without it count as nothing rather than as an error.
-
Create the dashboard.
In the CtrlPortals configuration, expand Dashboards and create one called
Time Reporting. -
Add a plot to it.
Add a segment, and inside it a component with its type set to Plot View.
-
Choose the chart type.
In the component’s Plot view section, give the chart a title and set Plot type to GroupedBars: one group of bars per value on the label axis, with one bar in each group per value of the split column.
-
Add a series.
Expand Query Configuration and add a series reading time objects. The one in the screenshot, Hours by Work Type:
- reads Time objects created in the last 30 days (
Created.DaysFrom() < 30); - selects the Work type, Employee and Hours properties as the columns
worktype,employeeandhours; - sums
hours, grouped byemployeeandworktype; - labels the axis by
worktypeand splits the bars byemployee, so each work type gets one bar per employee.
To chart hours by period instead, select a date property as well, set RoundDateTimeColumns and RoundDateTimeUnit, and use that column as the LabelColumn.
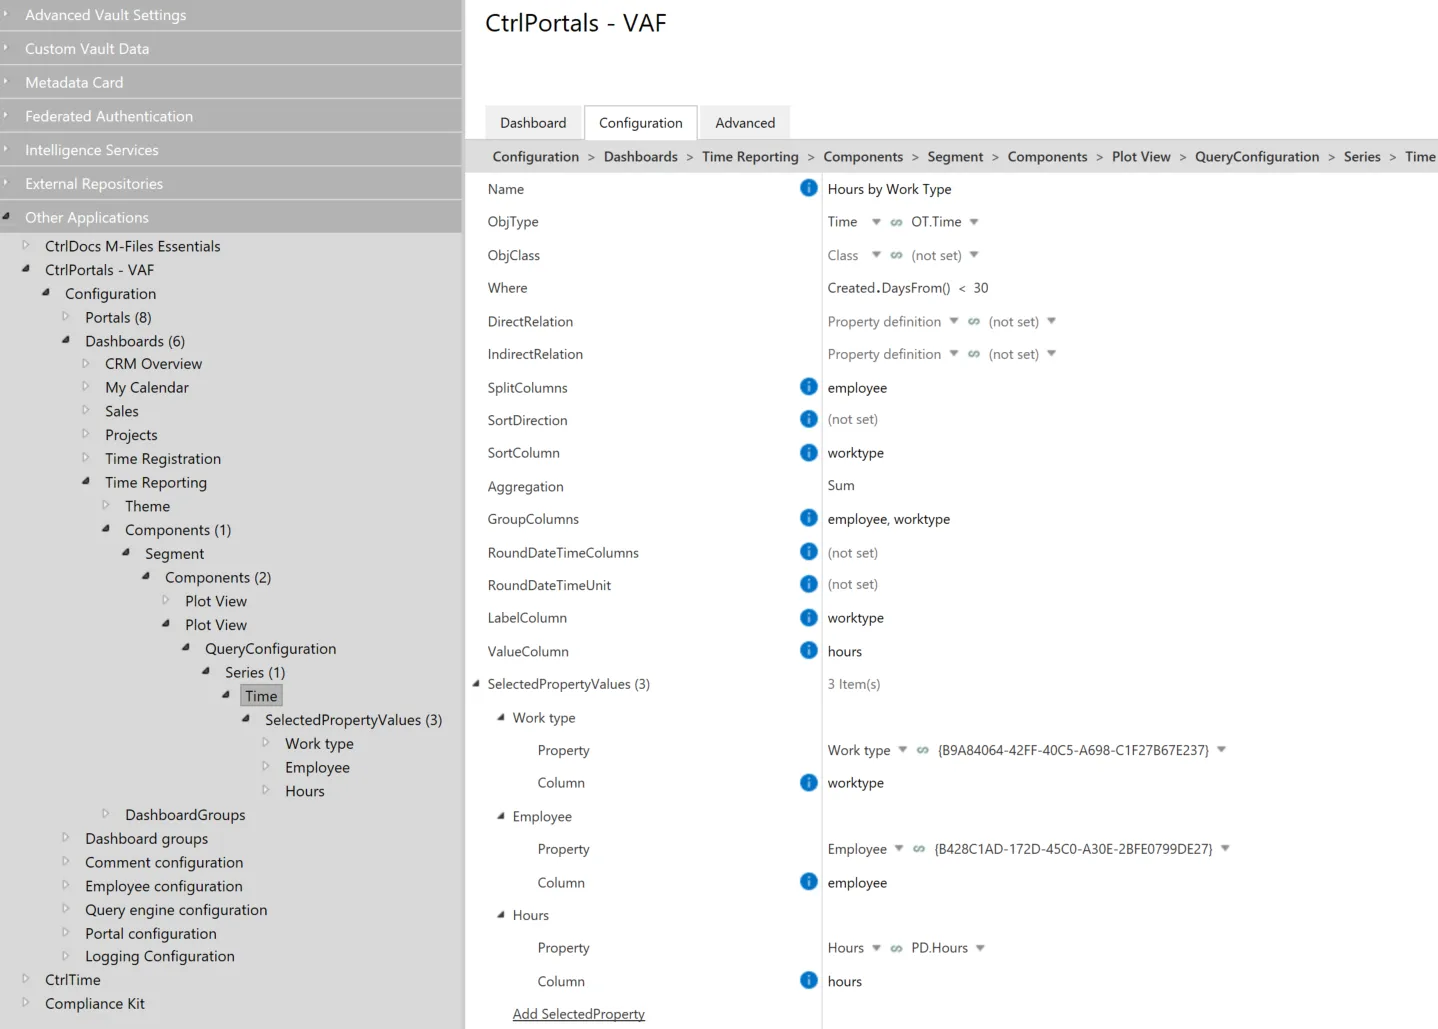
The series configuration behind the time reporting chart. - reads Time objects created in the last 30 days (
-
Refresh the configuration.
A plot does not pick up configuration changes until the configuration is refreshed. A chart that has not changed after an edit is almost always this.
What you have now
Section titled “What you have now”A dashboard totalling booked hours, grouped by the dimension you chose. Changing the grouping property is all it takes to answer a different question, so this one chart is the template for the rest.
For everything a plot can do, see the Plot component reference.